Chapter 9 Sensor Data Tools
The sensor-tools package provides command-line utilities for processing, analysing, and visualising sensor data collected by WildlifeSystems nodes (see Chapter 2). The package includes three main binaries: sensor-data, sensor-mon, and sensor-plot. sensor-mon must be run on a WildlifeSystems node, while sensor-data and sensor-plot can be run on any system with access to the sensor data files. Both sensor-data and sensor-plot can process files from multiple nodes.
For information on reading sensor data in real-time using sr, see Chapter 6. For a list of supported sensors, see Chapter 7.
9.0.1 sensor-data
The sensor-data tool is a Swiss army knife for processing sensor data files. It supports various commands for transforming data formats, filtering readings, counting entries, listing unique values, identifying errors, summarising error statistics, calculating detailed statistics, and finding the latest readings. While sr is minimal and focused on real-time sensor reading, sensor-data is designed for in-depth analysis of historical data stored in files.
9.0.2 sensor-mon
sensor-mon is an interactive terminal application that allows real-time monitoring of sensor data. It provides a user-friendly ncurses interface to view live readings from available sensors, complete with formatted JSON output and real-time graphs.
9.0.3 sensor-plot
sensor-plot is a terminal-based graphing tool that visualises historical sensor data from files. It can display up to five sensors simultaneously, allowing users to compare trends over time using an intuitive interface.
9.1 Installation
The sensor-tools package can be installed using the apt package manager:
This will install all three tools and their dependencies.
9.2 Sample Data
The examples in this chapter use a sample sensor data file containing 20 readings from three different sensor types across two nodes. The data includes:
- DS18B20 temperature sensor (10 readings): Temperature values in °C from
node001, including two error values (85°C indicates a communication error, -127°C indicates the sensor is disconnected or has undergone a power-on reset) - DHT22 humidity sensor (5 readings): Relative humidity percentages from
node001 - BME680 pressure sensor (5 readings): Atmospheric pressure in hPa from
node002
The timestamps span approximately 9 hours with readings taken at hourly intervals.
[{"sensor":"ds18b20","sensor_id":"28-0123456789ab","value":22.5,"unit":"C","timestamp":1737500000,"node_id":"node001"}]
[{"sensor":"ds18b20","sensor_id":"28-0123456789ab","value":22.7,"unit":"C","timestamp":1737503600,"node_id":"node001"}]
[{"sensor":"ds18b20","sensor_id":"28-0123456789ab","value":23.1,"unit":"C","timestamp":1737507200,"node_id":"node001"}]
[{"sensor":"ds18b20","sensor_id":"28-0123456789ab","value":22.9,"unit":"C","timestamp":1737510800,"node_id":"node001"}]
[{"sensor":"ds18b20","sensor_id":"28-0123456789ab","value":22.4,"unit":"C","timestamp":1737514400,"node_id":"node001"}]
[{"sensor":"ds18b20","sensor_id":"28-0123456789ab","value":85,"unit":"C","timestamp":1737518000,"node_id":"node001"}]
[{"sensor":"ds18b20","sensor_id":"28-0123456789ab","value":21.8,"unit":"C","timestamp":1737521600,"node_id":"node001"}]
[{"sensor":"ds18b20","sensor_id":"28-0123456789ab","value":21.5,"unit":"C","timestamp":1737525200,"node_id":"node001"}]
[{"sensor":"ds18b20","sensor_id":"28-0123456789ab","value":-127,"unit":"C","timestamp":1737528800,"node_id":"node001"}]
[{"sensor":"ds18b20","sensor_id":"28-0123456789ab","value":21.2,"unit":"C","timestamp":1737532400,"node_id":"node001"}]
[{"sensor":"dht22","sensor_id":"dht22_001","value":45.2,"unit":"%","timestamp":1737500000,"node_id":"node001"}]
[{"sensor":"dht22","sensor_id":"dht22_001","value":46.1,"unit":"%","timestamp":1737503600,"node_id":"node001"}]
[{"sensor":"dht22","sensor_id":"dht22_001","value":47.8,"unit":"C","timestamp":1737507200,"node_id":"node001"}]
[{"sensor":"dht22","sensor_id":"dht22_001","value":48.3,"unit":"%","timestamp":1737510800,"node_id":"node001"}]
[{"sensor":"dht22","sensor_id":"dht22_001","value":46.9,"unit":"%","timestamp":1737514400,"node_id":"node001"}]
[{"sensor":"bme680","sensor_id":"bme680_main","value":1013.25,"unit":"hPa","timestamp":1737500000,"node_id":"node002"}]
[{"sensor":"bme680","sensor_id":"bme680_main","value":1013.18,"unit":"hPa","timestamp":1737503600,"node_id":"node002"}]
[{"sensor":"bme680","sensor_id":"bme680_main","value":1012.95,"unit":"hPa","timestamp":1737507200,"node_id":"node002"}]
[{"sensor":"bme680","sensor_id":"bme680_main","value":1012.80,"unit":"hPa","timestamp":1737510800,"node_id":"node002"}]
[{"sensor":"bme680","sensor_id":"bme680_main","value":1013.05,"unit":"hPa","timestamp":1737514400,"node_id":"node002"}]
9.3 sensor-data
sensor-data is the primary tool for processing and analysing sensor data files. It provides several subcommands for different tasks.
9.3.1 Basic Usage
If no input files are specified, data is read from stdin. Input files can be JSON (.out format with one JSON array per line) or CSV.
9.3.2 Commands
9.3.2.1 transform
Transform sensor data between JSON and CSV formats, with optional filtering.
# Convert JSON to CSV
sensor-data transform -of csv sensor1.out

# Convert with error filtering
sensor-data transform --remove-errors -o output.csv sensor1.out

# Process all .out files in a directory recursively
sensor-data transform -r -e .out -o output.csv /var/ws/

# Filter by sensor type
cat sensor1.out | sensor-data transform --only-value sensor:ds18b20

# Filter by date range
sensor-data transform --min-date 2026-01-01 --max-date 2026-01-31 sensor.out

# Apply the --clean shorthand (removes empty values, errors, and duplicates)
sensor-data transform --clean sensor1.out## Pass 1: Discovering columns...
## Found 6 unique fields
## node_id,sensor,sensor_id,timestamp,unit,value
## node001,ds18b20,28-0123456789ab,1737500000,C,22.5
## node001,ds18b20,28-0123456789ab,1737503600,C,22.7
## node001,ds18b20,28-0123456789ab,1737507200,C,23.1
## node001,ds18b20,28-0123456789ab,1737510800,C,22.9
## node001,ds18b20,28-0123456789ab,1737514400,C,22.4
## node001,ds18b20,28-0123456789ab,1737518000,C,85
## node001,ds18b20,28-0123456789ab,1737521600,C,21.8
## node001,ds18b20,28-0123456789ab,1737525200,C,21.5
## node001,ds18b20,28-0123456789ab,1737528800,C,-127
## node001,ds18b20,28-0123456789ab,1737532400,C,21.2
## node001,dht22,dht22_001,1737500000,%,45.2
## node001,dht22,dht22_001,1737503600,%,46.1
## node001,dht22,dht22_001,1737507200,%,47.8
## node001,dht22,dht22_001,1737510800,%,48.3
## node001,dht22,dht22_001,1737514400,%,46.9
## node002,bme680,bme680_main,1737500000,hPa,1013.25
## node002,bme680,bme680_main,1737503600,hPa,1013.18
## node002,bme680,bme680_main,1737507200,hPa,1012.95
## node002,bme680,bme680_main,1737510800,hPa,1012.80
## node002,bme680,bme680_main,1737514400,hPa,1013.059.3.2.2 list-rejects
List readings that would be filtered out by specified filters. This is useful for inspecting data quality issues.
# Show readings that would be removed by --clean
sensor-data list-rejects --clean sensor1.out

# Show error readings
sensor-data list-rejects --remove-errors sensor1.out
# Show error readings from sample data
sensor-data list-rejects --remove-errors data/sample-sensors.out## Pass 1: Discovering columns...
## Found 6 unique fields
## [ { "node_id": "node001", "sensor": "ds18b20", "sensor_id": "28-0123456789ab", "timestamp": 1737518000, "unit": "C", "value": 85 } ]
## [ { "node_id": "node001", "sensor": "ds18b20", "sensor_id": "28-0123456789ab", "timestamp": 1737528800, "unit": "C", "value": -127 } ]9.3.2.3 count
Count sensor data readings with optional filtering and grouping.
# Count all readings
sensor-data count sensor1.out

# Count excluding errors
sensor-data count --remove-errors -r -e .out /var/ws/

# Count by sensor type
sensor-data count --by-column sensor_id sensor1.out

# Count by time period
sensor-data count --by-day sensor1.out      # YYYY-MM-DD
sensor-data count --by-week sensor1.out     # YYYY-Www (ISO week)
sensor-data count --by-month sensor1.out    # YYYY-MM
sensor-data count --by-year sensor1.out     # YYYY

# Output as CSV or JSON
sensor-data count -b sensor_id -of csv sensor1.out
sensor-data count -b sensor_id -of json sensor1.out
# Count readings by sensor type in sample data
sensor-data count --by-column sensor data/sample-sensors.out## Counts by sensor:
##
## sensor Count
## -------------------
## ds18b20 10
## dht22 5
## bme680 5
##
## Total: 20 reading(s)9.3.2.4 distinct
List unique values in a specified column.
# List unique sensor names
sensor-data distinct sensor sensor1.out

# List unique sensor IDs with counts (sorted by frequency)
sensor-data distinct sensor_id -c -r -e out /var/ws/

# Output as CSV or JSON
sensor-data distinct sensor -of csv sensor1.out
sensor-data distinct sensor -of json -c sensor1.out
# List unique sensors with counts from sample data
sensor-data distinct sensor -c data/sample-sensors.out## 10 ds18b20
## 5 bme680
## 5 dht229.3.2.5 list-errors
Find and list error readings in sensor data files. This detects DS18B20 sensors reporting values of 85 or -127, which indicate communication errors or disconnection.
## data/sample-sensors.out:6 sensor=ds18b20 sensor_id=28-0123456789ab value=85 [DS18B20 communication error (value=85)]
## data/sample-sensors.out:9 sensor=ds18b20 sensor_id=28-0123456789ab value=-127 [DS18B20 disconnected or power-on reset (value=-127)]
9.3.2.6 summarise-errors
Summarise error occurrences by type and sensor.
## Error Summary:
##   DS18B20 communication error (value=85): 1 occurrence
##   DS18B20 disconnected or power-on reset (value=-127): 1 occurrence
## Total errors: 2
9.3.2.7 stats
Calculate statistics for numeric sensor data. Provides comprehensive analysis including basic statistics, quartiles, outlier detection, and time-based metrics.
# Statistics for the 'value' column
sensor-data stats sensor1.out

# Statistics for a specific column
sensor-data stats -c temperature sensor1.out

# Clean statistics (excluding empty values and errors)
sensor-data stats --clean sensor1.out

# Follow mode for live updates
sensor-data stats -f sensor1.out## Statistics:
##
## Time Range:
## First: 2025-01-21 22:53:20 (1737500000)
## Last: 2025-01-22 07:53:20 (1737532400)
## Duration: 9h 0m 0s (32400 seconds)
## Rate: 2.00 readings/hour, 48.00 readings/day
##
## Sampling:
## Typical interval: 0s
## Gaps detected: 7 (max gap: 7200s = 2h 0m)
##
## value:
## Count: 18
## Min: 21
## Max: 1e+03
## Range: 9.9e+02
## Mean: 3e+02
## StdDev: 4.5e+02
##
## Quartiles:
## Q1 (25%): 23
## Median: 46
## Q3 (75%): 7.7e+02
## IQR: 7.5e+02
##
## Outliers (1.5*IQR):
## Count: 0
## Percent: 0.0%
##
## Delta (consecutive changes):
## Min: 0.0700
## Max: 966.3500
## Mean: 58.7088
## Volatility:233.9633
##
## Max Jump:
## Size: 966.3500
## From: 46.9000 -> 1013.25009.3.2.8 latest
Show the latest timestamp for each sensor.
# Get latest timestamp per sensor
sensor-data latest sensor1.out

# Limit output to first 5 sensors
sensor-data latest -n 5 sensor1.out

# Output as CSV or JSON
sensor-data latest -of csv sensor1.out
sensor-data latest -of json sensor1.out## Latest readings by sensor:
##
## Sensor ID Timestamp Date/Time
## --------------------------------------------------
## 28-0123456789ab 1737532400 2025-01-22 07:53:20
## bme680_main 1737514400 2025-01-22 02:53:20
## dht22_001 1737514400 2025-01-22 02:53:20
##
## Total: 3 sensor(s)9.3.3 Common Options
Most commands share these options:
| Option | Description |
|---|---|
-r, --recursive |
Recursively process subdirectories |
-e, --extension <ext> |
Filter files by extension (e.g., .out) |
-d, --depth <n> |
Maximum recursion depth |
-if, --input-format <fmt> |
Input format: json or csv |
-of, --output-format <fmt> |
Output format: json, csv, or human |
-o, --output <file> |
Output file (default: stdout) |
-v |
Verbose output |
-V |
Very verbose output |
9.3.4 Filtering Options
| Option | Description |
|---|---|
--min-date <date> |
Include only readings on or after this date |
--max-date <date> |
Include only readings on or before this date |
--remove-errors |
Remove DS18B20 error readings (value=85 or -127) |
--remove-empty-json |
Remove empty JSON input lines |
--not-empty <column> |
Skip rows where column is empty |
--not-null <column> |
Skip rows where column is “null” |
--only-value <col:val> |
Only include rows where column equals value |
--exclude-value <col:val> |
Exclude rows where column equals value |
--allowed-values <col> <vals> |
Only include rows where column is in allowed values |
--unique |
Remove duplicate rows |
--clean |
Shorthand for common cleaning options |
--tail <n> |
Only read last n lines from each file |
9.4 sensor-mon
sensor-mon provides an interactive ncurses-based terminal interface for real-time monitoring of sensor data.
9.4.1 Usage
When started, sensor-mon scans for executable sensor-* programs in the PATH, verifies they respond correctly to the “identify” command, and displays a list of available sensors.
9.4.2 Controls
| Key | Action |
|---|---|
1-9 |
Select sensor to monitor |
b |
Return to sensor list |
[ |
Show previous result (multiple readings) |
] |
Show next result (multiple readings) |
q |
Quit |
9.4.3 Display
The sensor view shows:
- Top half: Formatted JSON output from the selected sensor
- Bottom half: Real-time graph of the “value” field, updated every second
Colour is used when available:
- Green: Frame and borders
- Blue: Graph data points and lines
- Reversed: Header text background
9.4.4 Sensor Requirements
For a sensor application to be detected by sensor-mon, it must:
- Be named with the prefix “sensor-” (e.g., sensor-dht22, sensor-ds18b20)
- Be executable and in the system PATH
- Exit with status code 60 when called with the “identify” argument
- Output JSON data when called with the “all” argument
9.5 sensor-plot
sensor-plot displays historical sensor data from .out files as graphs. Up to 5 sensors can be displayed simultaneously.
9.5.1 Screenshots
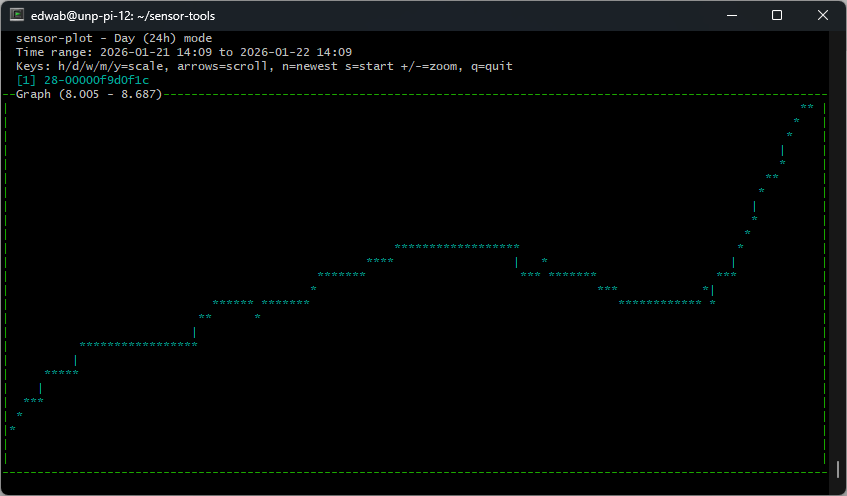
Figure 9.1: sensor-plot displaying temperature data in day mode, showing 24 hours of readings.
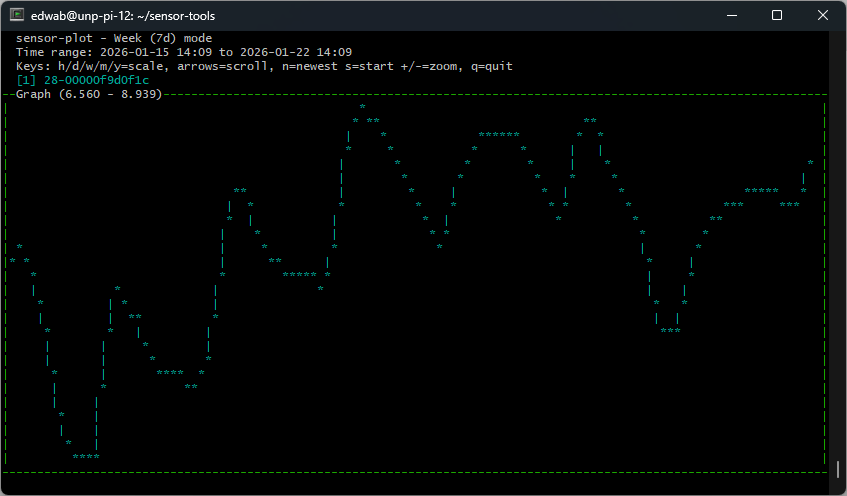
Figure 9.2: sensor-plot displaying temperature data in week mode, showing 7 days of readings.
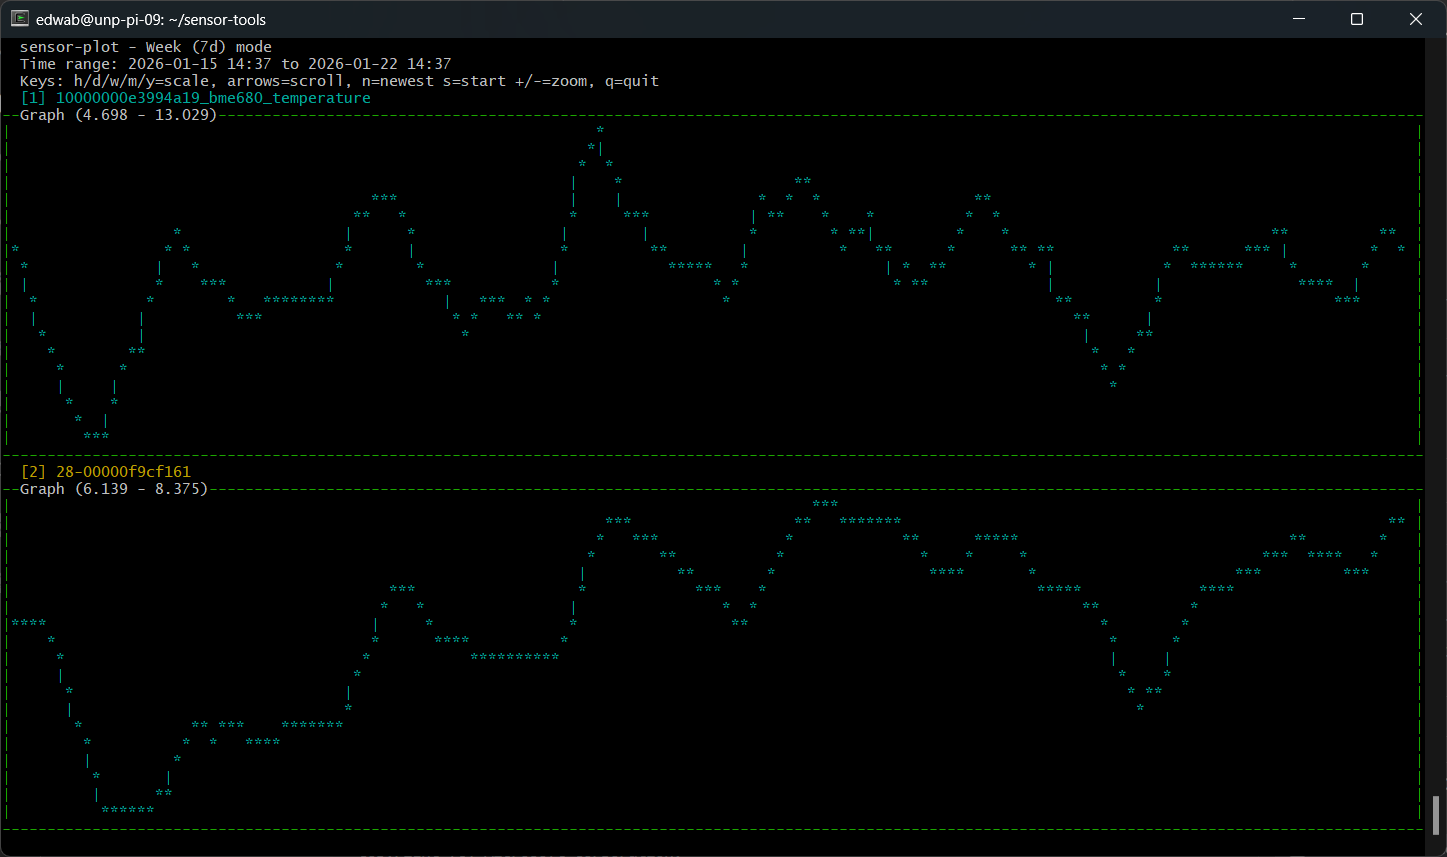
Figure 9.3: sensor-plot displaying multiple sensors simultaneously, allowing comparison of different data streams.
9.5.3 Options
| Option | Description |
|---|---|
--sensor <ID> |
Sensor ID to plot (can be specified up to 5 times) |
-r, --recursive |
Search subdirectories for data files (default) |
-R, --no-recursive |
Do not search subdirectories |
-e, --extension <ext> |
Only read files with the specified extension |
-h, --help |
Display help |
9.5.4 Controls
| Key | Action |
|---|---|
| Left/Right Arrow | Scroll the time window |
h |
Hour mode (1 hour view, 1 minute scroll) |
d |
Day mode (24 hour view, 1 hour scroll) |
w |
Week mode (7 day view, 1 day scroll) |
m |
Month mode (30 day view, 1 week scroll) |
y |
Year mode (365 day view, 1 month scroll) |
r |
Reload data from disk |
q |
Quit |